📊 Gym Admin BI Project – Revenue Analysis & Insights
Project Type: Business Intelligence & Data Visualization
Role: Data Analyst
Tools: Power BI (DAX), SQL
Context: Personal Project – End-to-End Data Analysis (Database → Insights)
🔍 Project Overview
This project analyzes product sales and service payments for a gym management system. The goal is to understand where revenue is coming from, identify key income drivers, and provide actionable insights that could support managerial decision‑making.
The analysis combines:
- SQL (joins, aggregations, CTEs) for data preparation
- Power BI for visualization and storytelling
- A business‑oriented approach, focusing on revenue impact rather than raw metrics
🎯 Business Questions Addressed
- What is the total revenue generated by the gym?
- How is revenue distributed between product sales and services?
- Which products generate the most income?
- Which services contribute the most to total revenue?
- Is revenue concentrated or diversified across offerings?
🧮 Data Preparation (SQL)
The dataset was prepared using SQL queries that:
- Join transactional tables with descriptive dimensions (products, services, clients)
- Aggregate totals and counts
- Use CTEs to improve readability and maintainability
This ensured that the data consumed by Power BI was already clean, structured, and business‑ready.
📈 Dashboard 1 – Product Sales Overview
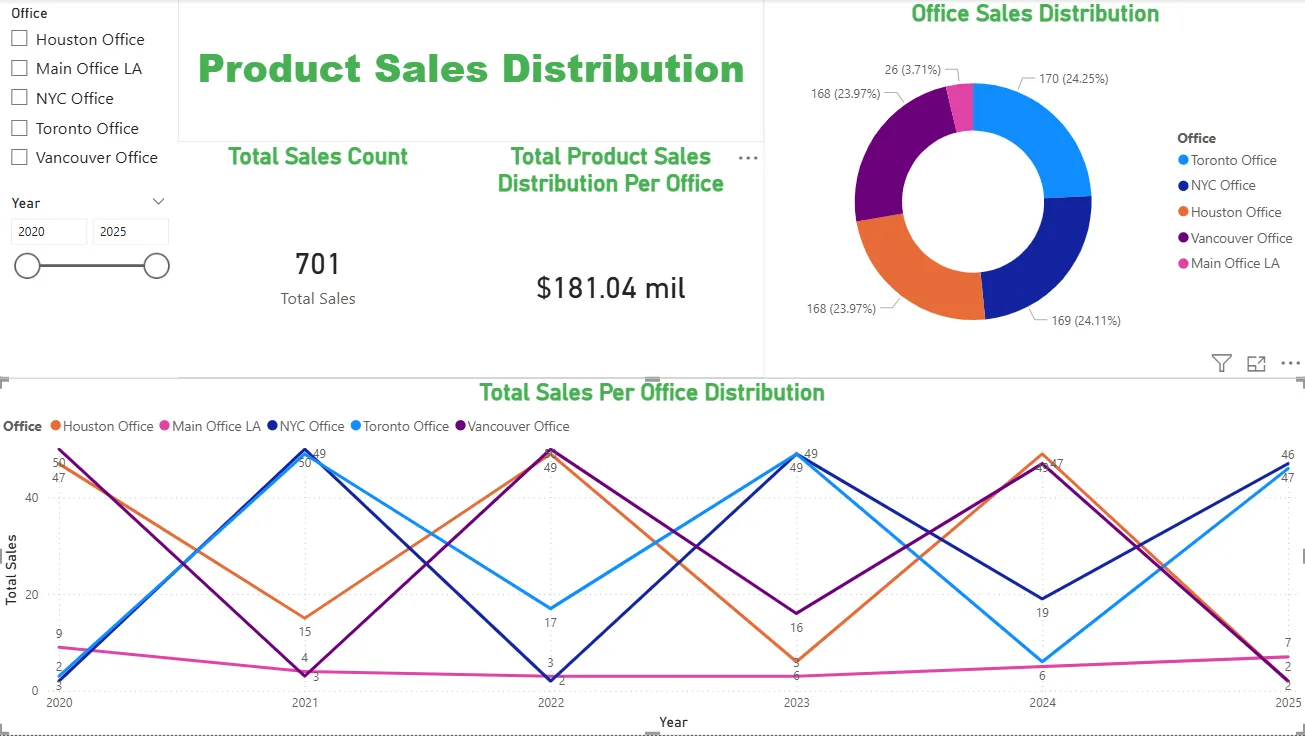
🔎 Key Insights
- Treadmills generate over 90% of total product revenue, despite not having the highest number of transactions.
- Lower‑priced items (Yoga Mats, Resistance Bands, Dumbbells) sell regularly but contribute marginally to total income.
💡 Business Interpretation
- Revenue is highly dependent on a single high‑value product.
- While accessories support volume, they do not significantly impact revenue.
✅ Actionable Insight
- Consider strategies to reduce revenue dependency on treadmills (bundles, premium accessories, upsells).
- Review pricing or promotion strategies for low‑impact products.
📈 Dashboard 2 – Services Revenue Analysis
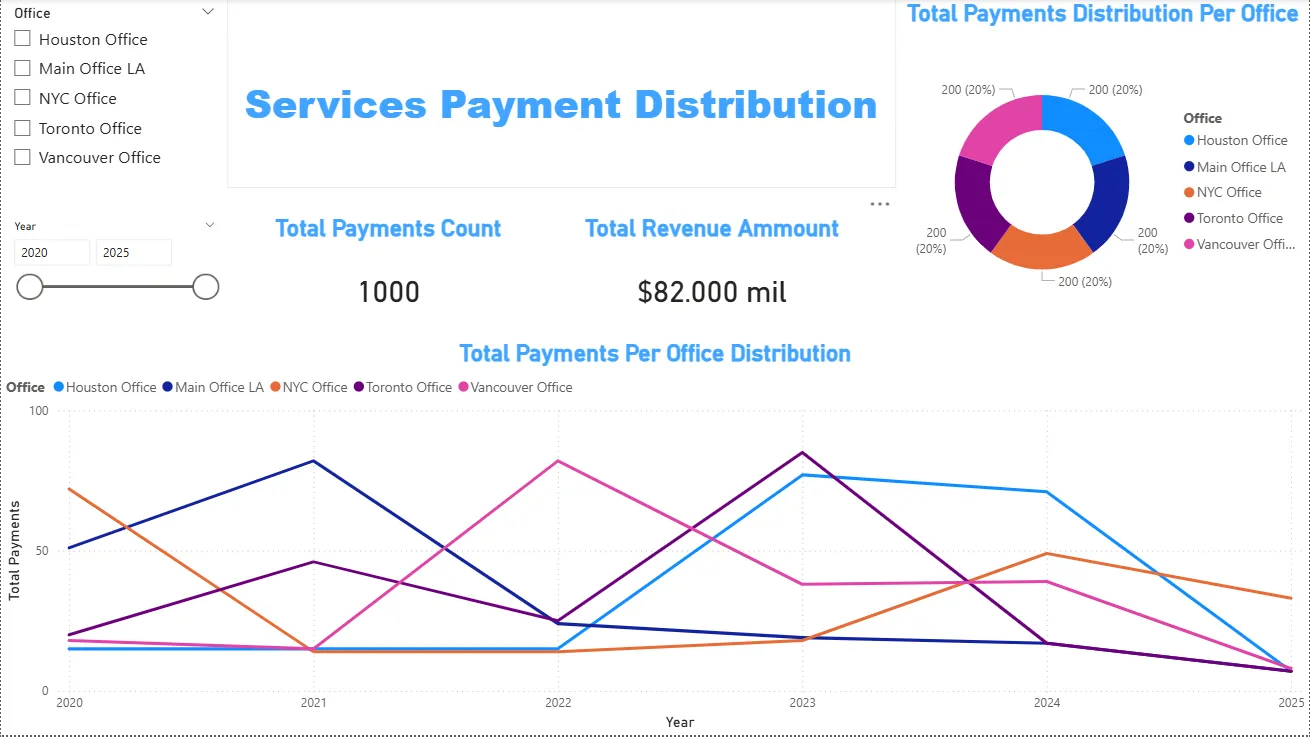
🔎 Key Insights
- Physiotherapy Sessions and Personal Training are the top revenue‑generating services.
- All services show a similar number of payments, but revenue varies due to pricing differences.
💡 Business Interpretation
- Revenue differences are driven primarily by service value, not volume.
- Premium services contribute disproportionately more income.
✅ Actionable Insight
- Focus marketing efforts on high‑value services.
- Evaluate opportunities to upsell lower‑priced services into premium packages.
📊 Dashboard 3 – Global Income Overview
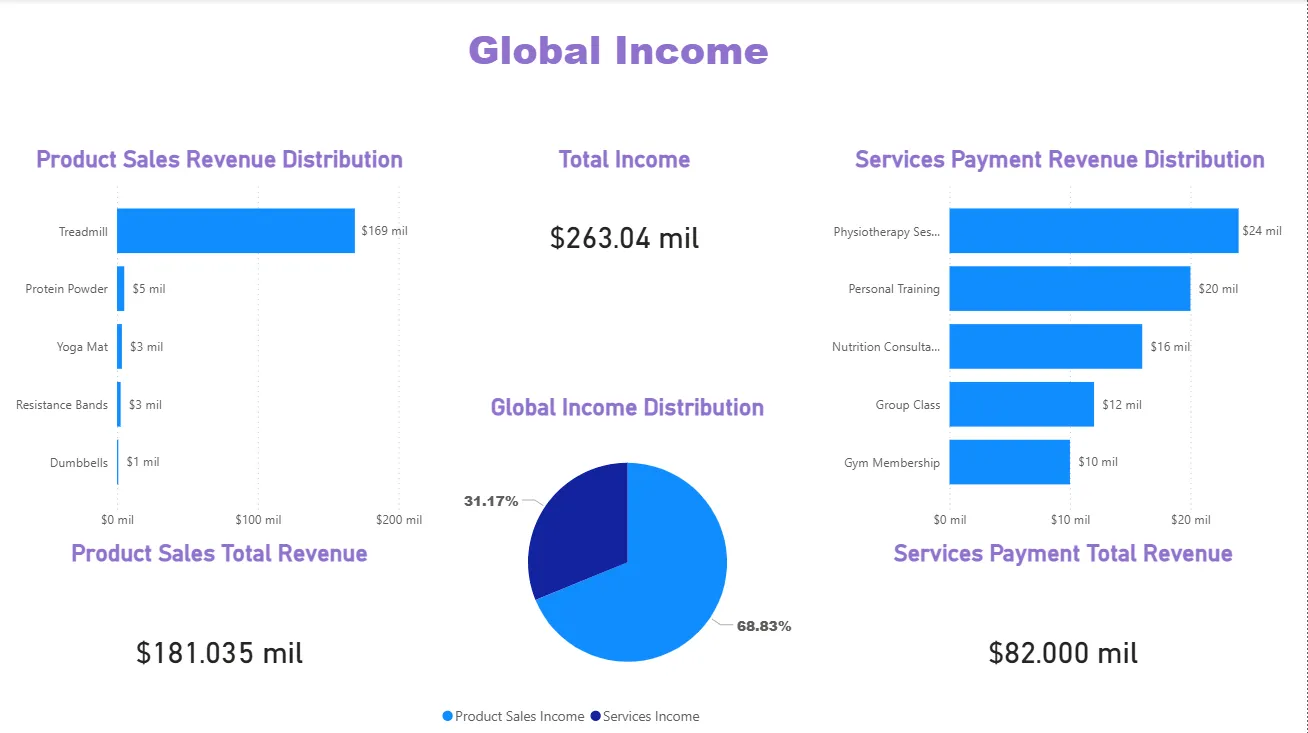
🔎 Key Insights
- Total Income: $263K
- Product Sales: 68.8% of total revenue
- Services Payments: 31.2% of total revenue
- Product revenue is less diversified, while services show a more balanced distribution.
💡 Business Interpretation
- The gym relies more on product sales than services for total income.
- Services provide more stable and diversified revenue, reducing financial risk.
✅ Actionable Insight
- Strengthen service offerings to create recurring and predictable income.
- Use services to stabilize revenue against fluctuations in high‑ticket product sales.
🧠 Overall Conclusions
- Revenue is concentrated, particularly in treadmill sales.
- Services offer a more balanced and sustainable revenue model.
- A combined strategy of high‑value products and recurring services is key to long‑term stability.